How to use get_cap to select and plot voltage curves
[1]:
import matplotlib.pyplot as plt
import numpy as np

import cellpy
from cellpy.utils import example_data
[2]:
c = example_data.cellpy_file()
(cellpy) - cycle mode not found
[3]:
c.get_cycle_numbers()
[3]:
array([ 1,  2,  3,  4,  5,  6,  7,  8,  9, 10, 11, 12, 13, 14, 15, 16, 17,
       18, 19, 20, 21, 22, 23, 24, 25, 26, 27, 28, 29, 30, 31, 32, 33, 34,
       35, 36], dtype=int64)
[4]:
curves1 = c.get_cap(cycle=[1, 2, 3, 4, 5])
[5]:
curves1.head()
[5]:
| voltage | capacity | |
|---|---|---|
| 1068 | 0.110245 | 0.000003 |
| 1069 | 0.115479 | 0.278791 |
| 1070 | 0.120714 | 1.425499 |
| 1071 | 0.125948 | 3.227624 |
| 1072 | 0.131183 | 5.280277 |
[6]:
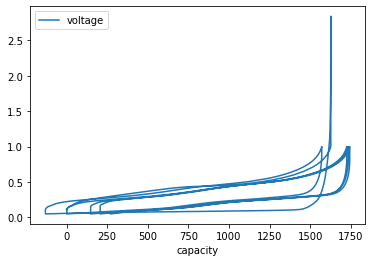
curves1.plot(x="capacity", y="voltage");
[7]:
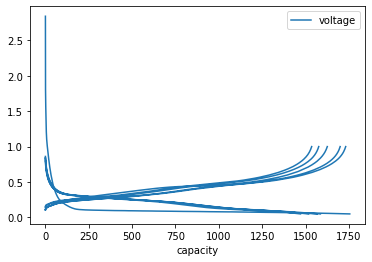
curves2 = c.get_cap(cycle=[1, 2, 3, 4, 5], method="forth-and-forth")
curves2.plot(x="capacity", y="voltage");
[8]:
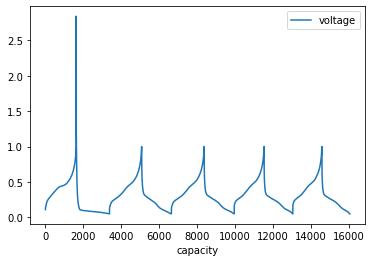
curves3 = c.get_cap(cycle=[1, 2, 3, 4, 5], method="forth")
curves3.plot(x="capacity", y="voltage");
[9]:
import hvplot.pandas
[10]:
curves4 = c.get_cap(
    cycle=[1, 2, 3, 10, 20], method="back-and-forth", label_cycle_number=True
)
curves4.head()
[10]:
| cycle | voltage | capacity | |
|---|---|---|---|
| 1068 | 1 | 0.110245 | 0.000003 |
| 1069 | 1 | 0.115479 | 0.278791 |
| 1070 | 1 | 0.120714 | 1.425499 |
| 1071 | 1 | 0.125948 | 3.227624 |
| 1072 | 1 | 0.131183 | 5.280277 |
[11]:
curves4.hvplot(x="capacity", y="voltage", by="cycle", width=500)
[11]:
[ ]: